
It's 6:45 on a Tuesday. I'm at my office desk with a stack of purchase orders that never seems to shrink, and my printer is flashing that orange light again. "How do I get my printer back online?" is the fourth time I've typed that into Google this quarter.
That moment—staring at a machine that technically works but might as well be broken—is a decent metaphor for how school supply budgeting actually plays out. You're not dealing with one big problem. You're dealing with a thousand small failures that bleed your budget dry, one reprint at a time.
The Problem Everyone Points To: Not Enough Money
Every August, the requests roll in. The math department needs calculators. The early childhood team wants a new pretend play set. Someone's asking for STEM kits, whiteboards, measuring tools. And the principal's answer is always the same: "We don't have the money."
I used to believe that too. For my first two years in this role, I operated on the assumption that our budget was simply too small. Then I actually audited our 2023 spending, and the numbers told a different story.
Here's the uncomfortable truth: we weren't spending too much. We were spending badly.
What I Found When I Audited Six Years of Spending
I've tracked every purchase order since 2019. (Yes, every single one.) When I finally sat down with our cost tracking system and analyzed $180,000 in cumulative spending, three patterns jumped out. None of them were "we need more money."
Pattern #1: Cheap Calculators Are the Most Expensive Option
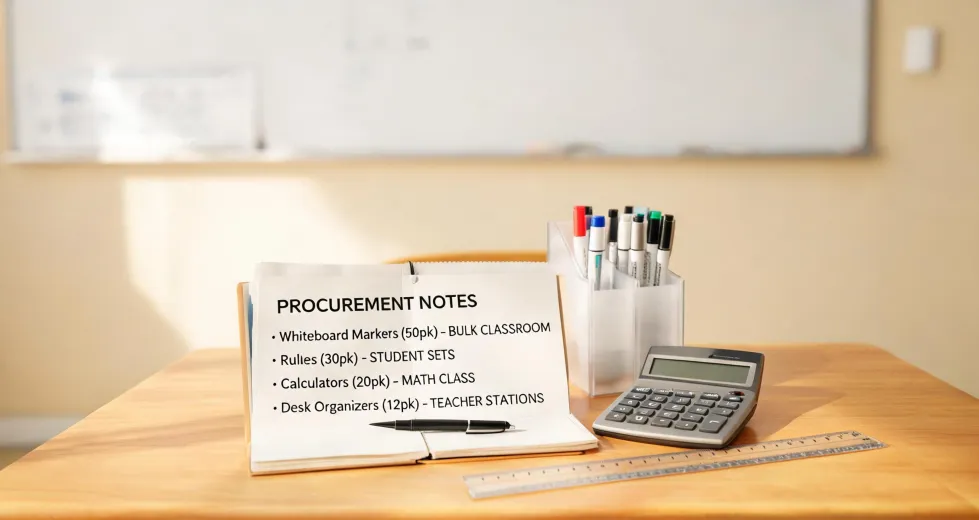
In 2022, we bought forty basic four-function calculators at $4.50 each for a math classroom. Looked like a responsible purchase—under $200 for the whole class set. By January 2023, eleven of them were broken. By June, we'd replaced nineteen.
Meanwhile, the ACT-approved calculator models I'd been reluctant to order at $14–18 each? The ones we piloted for our testing program in 2023? Sixteen months later, every single one still worked.
So I did the math. The $4.50 calculator costs $4.50 per year if it lasts twelve months. The $16 calculator, spread over a five-year lifespan, costs $3.20 per year. The "expensive" one was 40% cheaper over its usable life. (Pricing based on quotes from our educational supply vendors, January 2022 and June 2023—these rates shift constantly, so verify current pricing before budgeting.)
That's the thing nobody tells you about school procurement: the lowest quote is rarely the lowest cost.
Pattern #2: "Free" Resources Are Never Free
I'm not here to dunk on free resources for student learning. I've downloaded hundreds of worksheets, activity packs, and lesson plans myself. Some of them are genuinely excellent.
But here's what the "free" label doesn't include: the teacher's time.
Last year, I asked our teachers to track prep time on digital freebies. The results were uncomfortable. A typical free worksheet packet took 45 minutes to download, sort, print, and adapt. That's before you discover the page with the cramped font or the math problem that formats incorrectly and needs to be reprinted.
A veteran teacher at our school joked that the most expensive resources in education are free printables. With a loaded cost of roughly $40 per hour for teacher time (based on the median U.S. teacher salary reported by the Bureau of Labor Statistics for May 2023, plus benefits), one "free" packet that eats an hour of prep is more expensive than a $12 ready-to-use classroom resource. Use it five times, and you've spent $200 in teacher time on something that cost nothing.
Honestly, I'm not sure why this math evaded us for so long. My best guess is that we conflated "no price tag" with "no cost." They're very different things.
Pattern #3: Operational Friction Is a Budget Killer
The printer thing is not a joke. In 2024, I logged 47 internal IT tickets related to printing failures—jammed paper, offline queues, driver issues. Average resolution time: about 25 minutes per incident. That's roughly 20 hours of staff time lost to print problems in a single year. For a school, that's not a technology problem. That's a staffing budget problem wearing a trench coat.
The same logic applies to broken equipment. The $650 office desk that wobbles after six months. The $220 classroom rug that unravels. The $40 STEM kit that arrives with half its components missing.
Every one of those items carries a hidden cost: the administrative time to process a replacement order, the teacher time spent re-planning around a missing resource, the student learning time lost while a substitute activity gets pulled together.
What This Actually Costs a School
Let me put real numbers on this, because "we buy cheap stuff and it wears out" sounds vague. Here's what the data showed over six years:
- 38% of our supply budget went to replacing broken or failed items. Not upgrading. Replacing. Buying the same thing twice (or three times) because the first version didn't survive the school year.
- One class set of "bargain" calculators had to be re-purchased every 14 months. Fourteen months. That's not a purchase, that's a subscription.
- Teachers were quietly subsidizing our procurement mistakes. According to a 2023 NEA survey, educators spend an average of $500+ of their own money on classroom supplies annually. Our internal survey showed the same pattern.
- The "pretend play" category showed the most dramatic variance. We'd bought a cheap play food set that fell apart in three weeks and had to be discarded for safety. Compare that with the Learning Resources Pretend & Play School Set we purchased in 2021—it's survived three years of daily use by four-year-olds and still has every piece. It cost 2.3x the cheap alternative and is now roughly 4x cheaper on a per-use basis. (Costs from our 2021 purchase orders and 2024 replacement records. Product availability changes, so check current listings.)
These numbers forced me to confront something uncomfortable. The problem wasn't the budget. The problem was my own procurement framework. I was optimizing for the wrong variable.
What Changed When We Switched to Value-Based Purchasing
I'm not going to pretend I had a eureka moment. It was more like a slow, grumpy realization after the 2023 audit. I built a simple total cost of ownership (TCO) spreadsheet and forced every purchase request through it.
The formula is embarrassingly simple:
Total Cost Per Use = (Unit Price + Replacement Cost + Staff Prep Time) ÷ Expected Lifespan in Uses
That's it. No complex supply-chain modeling. Just a willingness to ask: "What does this actually cost per year of real use in a classroom?"
Here's what changed in practice:
- Calculators: We standardized on durable models from established brands. We spent more per unit and 31% less per year over three years.
- Free resources: We didn't stop using them. We added a 15-minute prep limit. If a "free" resource can't be made classroom-ready in a quarter hour, we buy a paid resource that comes pre-structured. The saved teacher time pays for it many times over.
- Hands-on and STEM materials: This is where Learning Resources became our default vendor. I'll be direct with you: their products aren't the cheapest on the supplier list. But across dozens of purchases—math manipulatives, the Pretend & Play School Set for our early childhood program, STEM classroom bundles, measuring tools, whiteboards—they have the lowest failure rate of any brand we've used in six years. They also publish clear product specifications and replacement policies, which makes our admin work measurably easier.
I've seen vendor comparison spreadsheets from other schools where someone created a "value score" by dividing price by durability rating. That's a reasonable starting point. But after six years of reviewing purchase orders, the cheapest option has cost us more in roughly 60% of cases. The pattern is consistent enough that our procurement policy now requires quotes from at least three vendors, with the TCO calculation included in the review—not just the sticker price.
A few practical steps if you're reading this and want to fix your own budget:
- Track failures, not just purchases. Add a "replacement of:" field to your purchase order system. You'll see the pattern within a quarter.
- Set a prep-time budget for free resources. Fifteen minutes is a good threshold for most classrooms.
- Buy for the lifespan you actually need. A cheap calculator that fails mid-year isn't cheaper than a durable one that lasts five. It's just a delayed expense with extra paperwork.
- Build a short trusted-vendor list. Ours includes Learning Resources for hands-on classroom materials—not because they're perfect, but because they're predictable. And predictability is worth real money when you're managing a budget.
The Real Problem Was Never the Budget
I think back to that printer at 6:45 AM, blinking its orange light at me. I used to file that under "technology problems." Now I recognize it as a cost problem. Every minute our team spends fighting broken equipment or adapting "free" resources is a minute we've already paid for—just not in a line item anyone noticed.
The schools that make their supply budgets stretch aren't the ones with more money. They're the ones who stopped asking "What's the cheapest option?" and started asking "What's the real cost of this decision?"
That question—and a spreadsheet—saved us over $8,000 in the first year alone. Roughly 17% of our total budget. Money we could finally point at actual student learning resources instead of replacement orders.
The budget wasn't the problem. The thinking was. Once that changed, everything else followed.
Pricing references in this article are based on our school's purchase orders and vendor quotes from 2019–2024. Educational supply pricing shifts frequently, so verify current rates at official retailer or supplier sites. Teacher salary and spending figures reference BLS May 2023 data and the NEA 2023 survey; verify current data at bls.gov and nea.org.